
A flight recorder for AI coding agents.
You want one place to measure developer productivity while developers want the freedom to use any tool — Observer bridges the gap by aggregating cost, value, and waste metrics across Claude Code, Codex, and Cursor into a single unified view, fully self-hosted so nothing leaves your infrastructure.
Why we built it
We were spending thousands a month on coding agents with no idea where the tokens were going, which sessions actually shipped code, or whether secrets were leaking into traces.
Observer is what we built to find out. We open-sourced it because every team running AI agents in production needs the same thing.
The dashboard
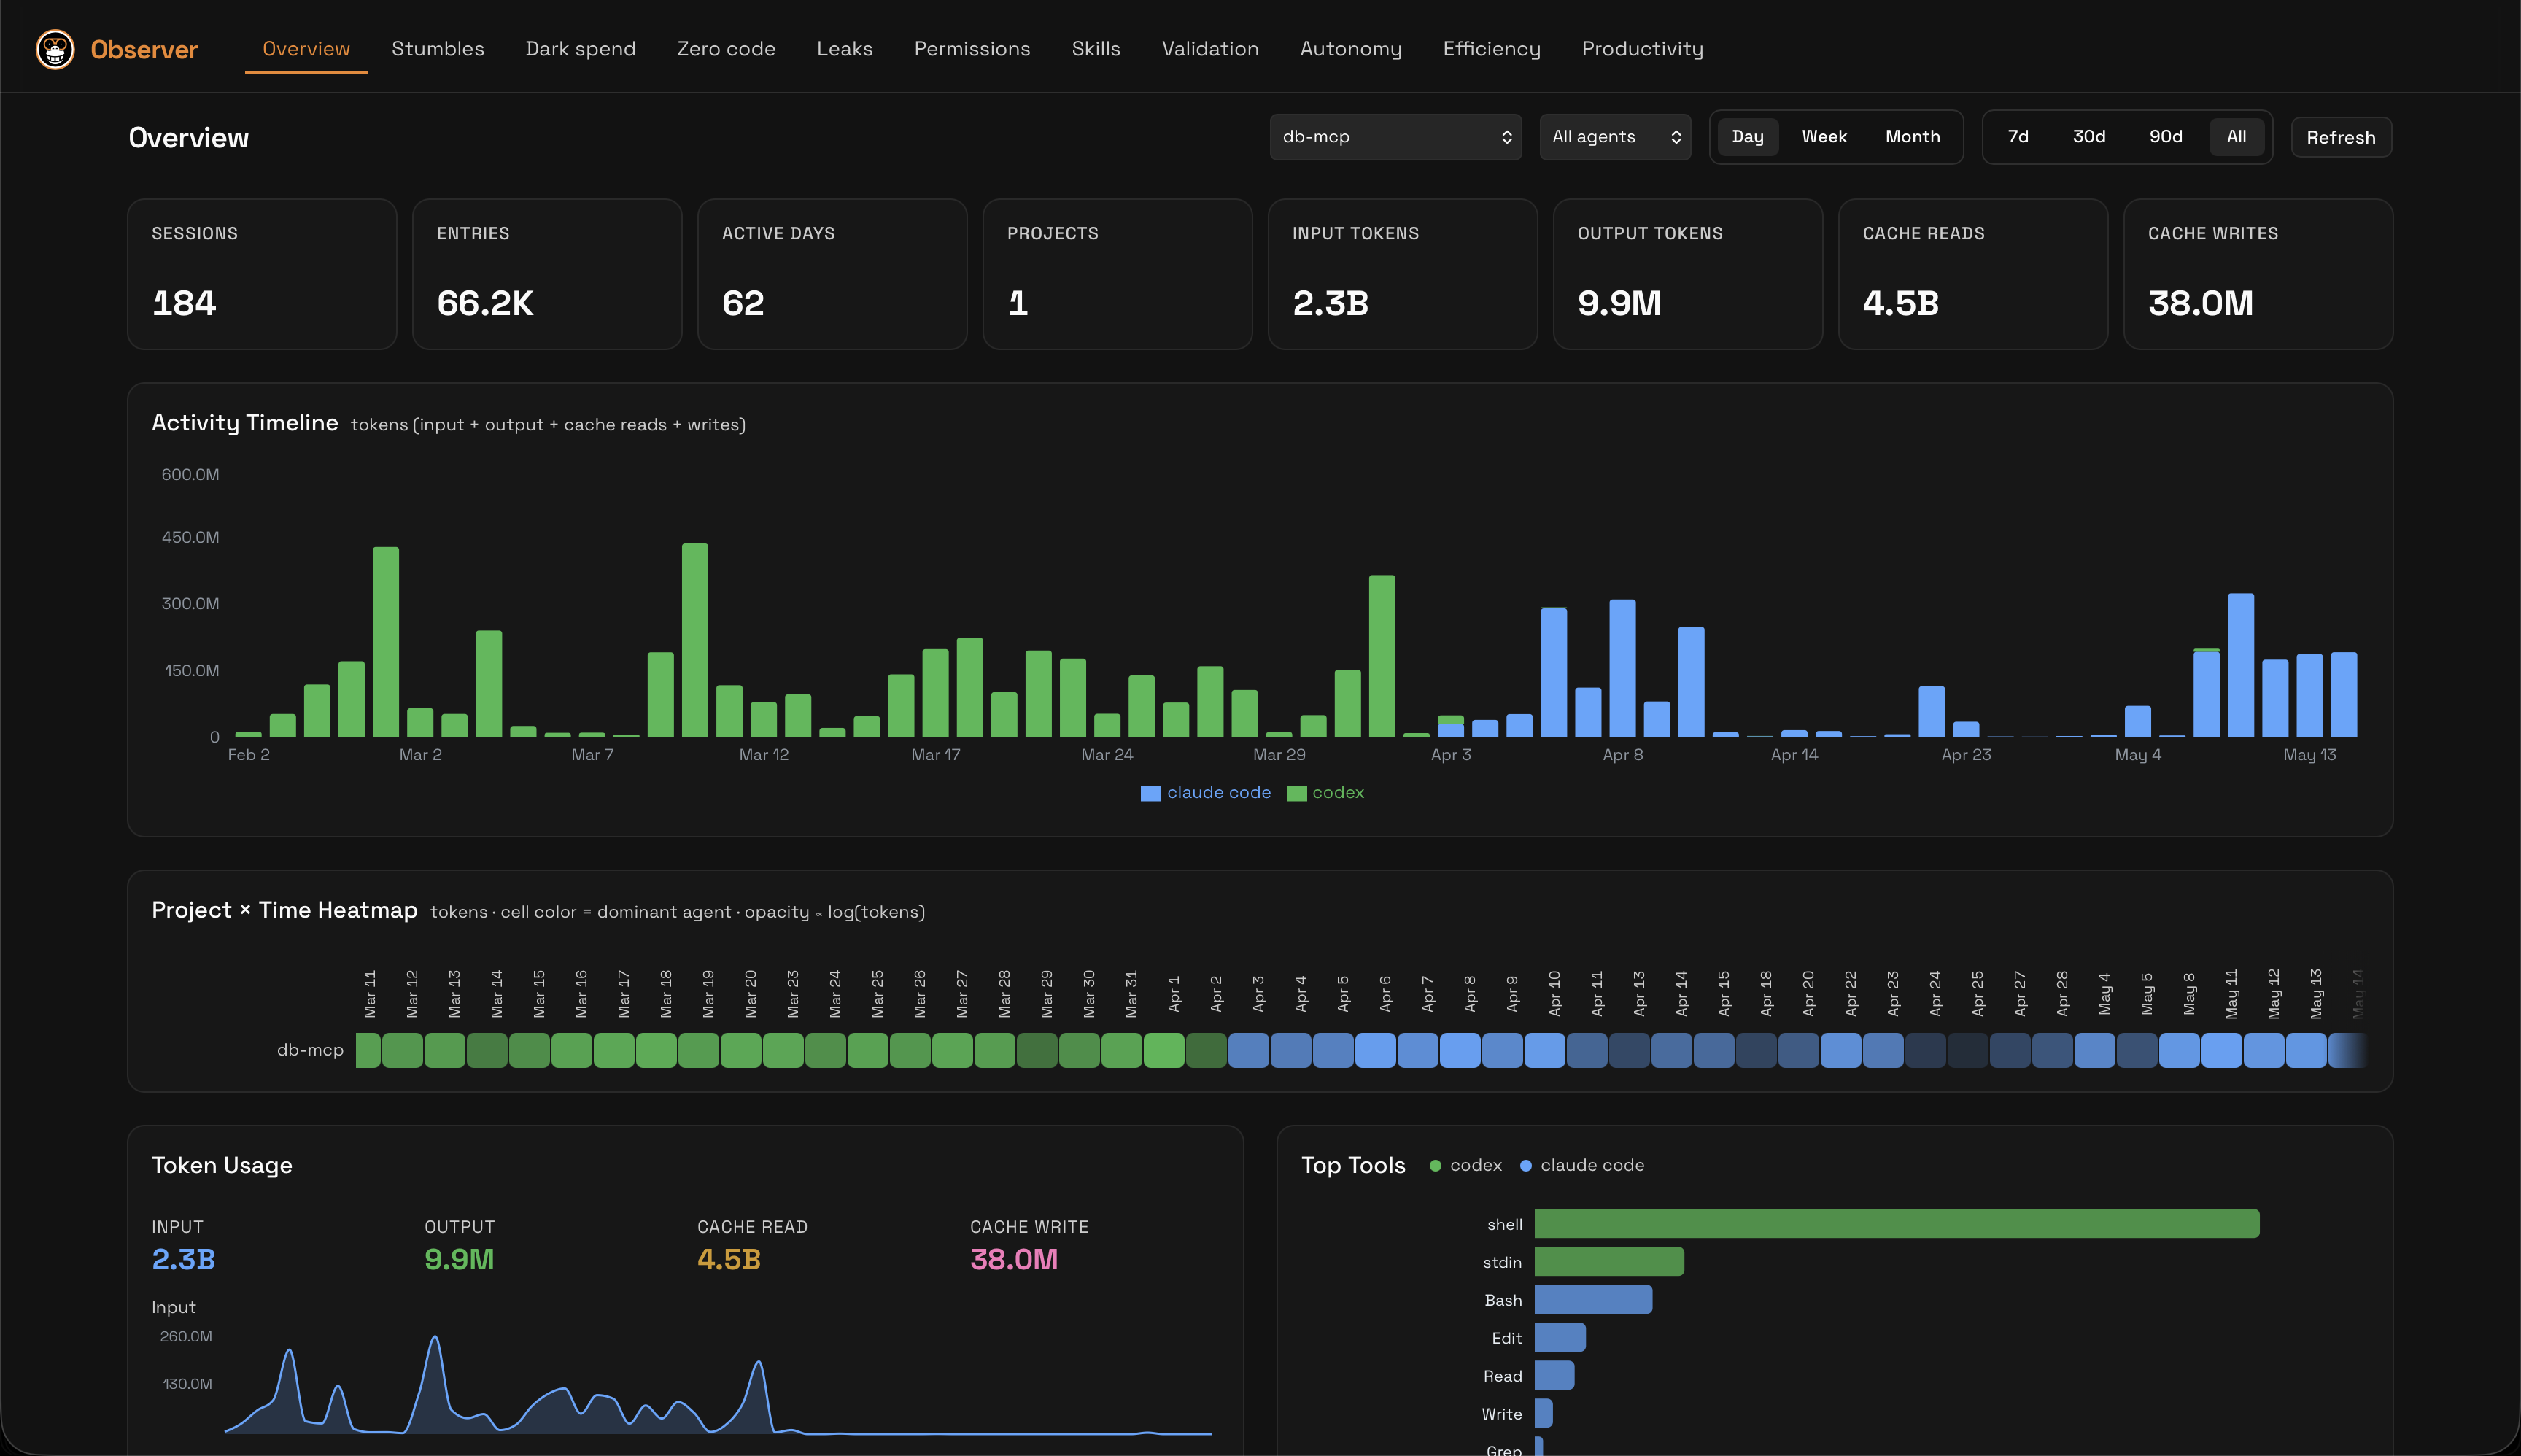
Eleven views, one trace stream.
Each tab answers a question you couldn't answer before. All driven by the same local data, no extra instrumentation.
- 01Overview
Sessions, tokens, projects, activity, top tools, models, commits.
- 02Stumbles
Repeated-loop detection — spot when an agent got stuck.
- 03Dark spend
Token burn with no committed output.
- 04Zero code
Sessions where nothing landed.
- 05Leaks
Secret / PII surface area inside agent traces.
- 06Permissions
Tool calls outside the agent's intended scope.
- 07Skills
Which user-defined skills the agent reached for.
- 08Validation
Lint, type, and test failures the agent worked around.
- 09Autonomy
How much of the session ran without a human.
- 10Efficiency
Cache-read ratio, redo rate, useful-token rate.
- 11Productivity
Lines and commits attributable to the agent, per project.
What you get
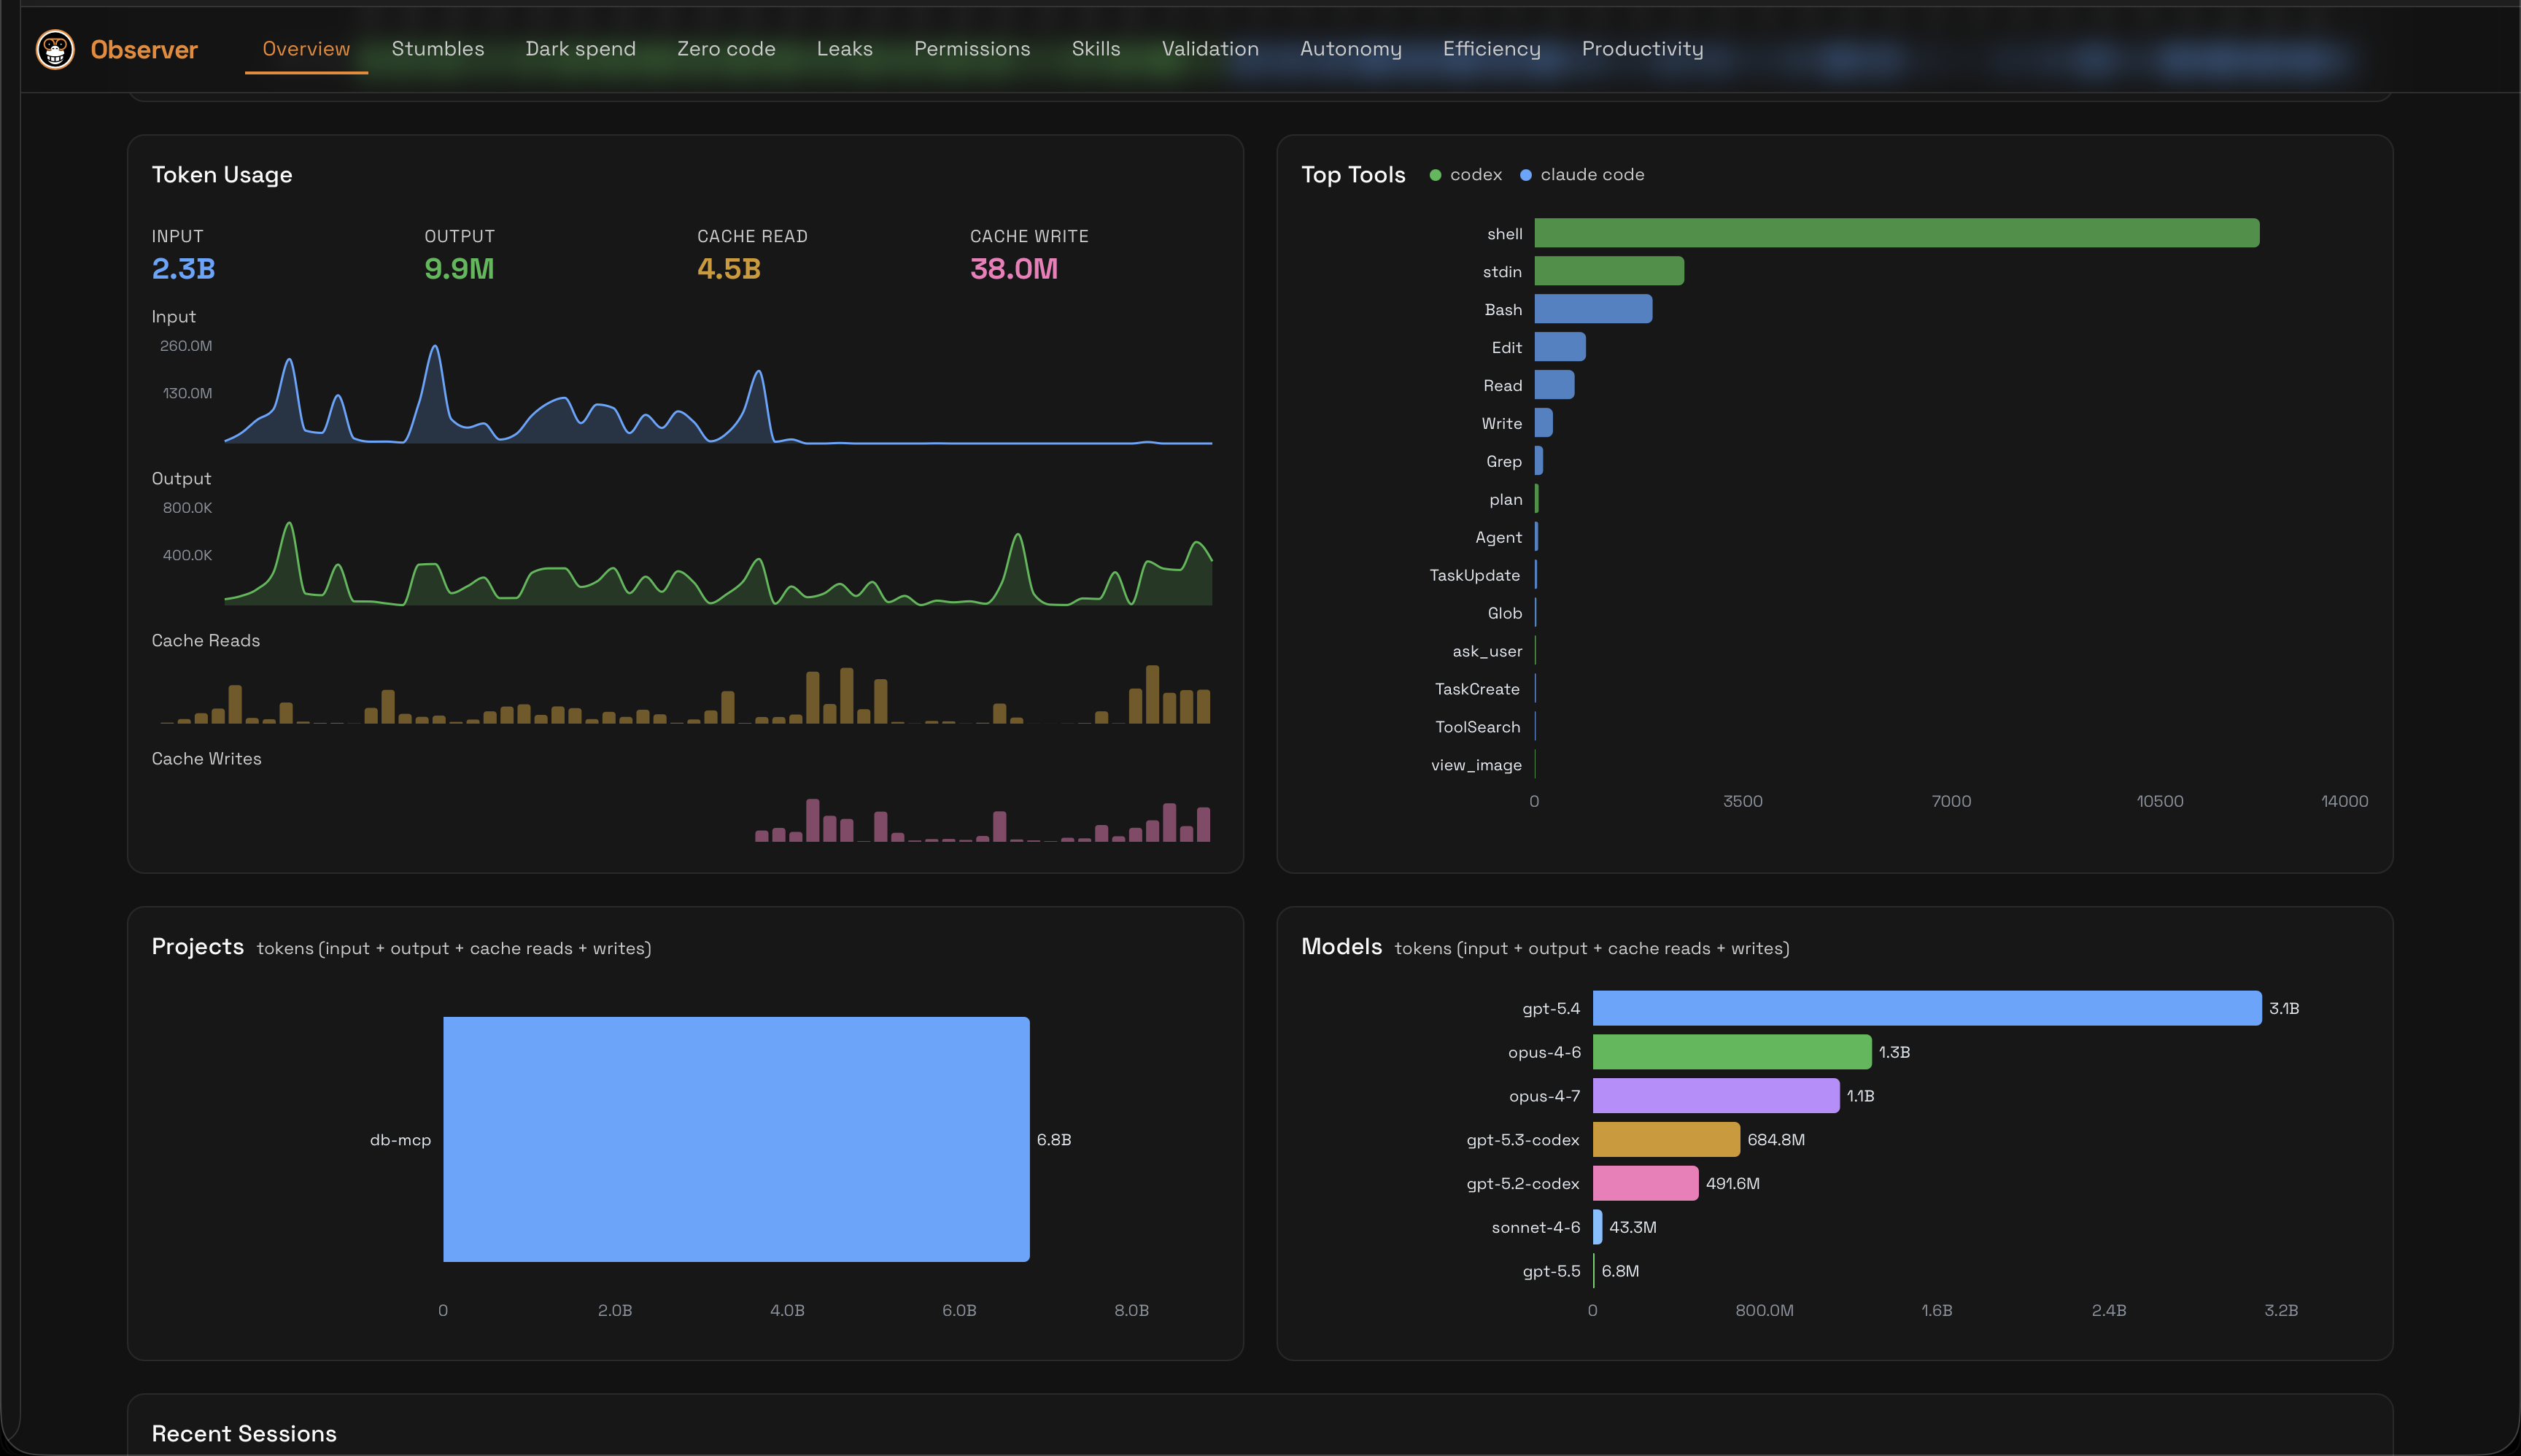
Three things you couldn't see before.
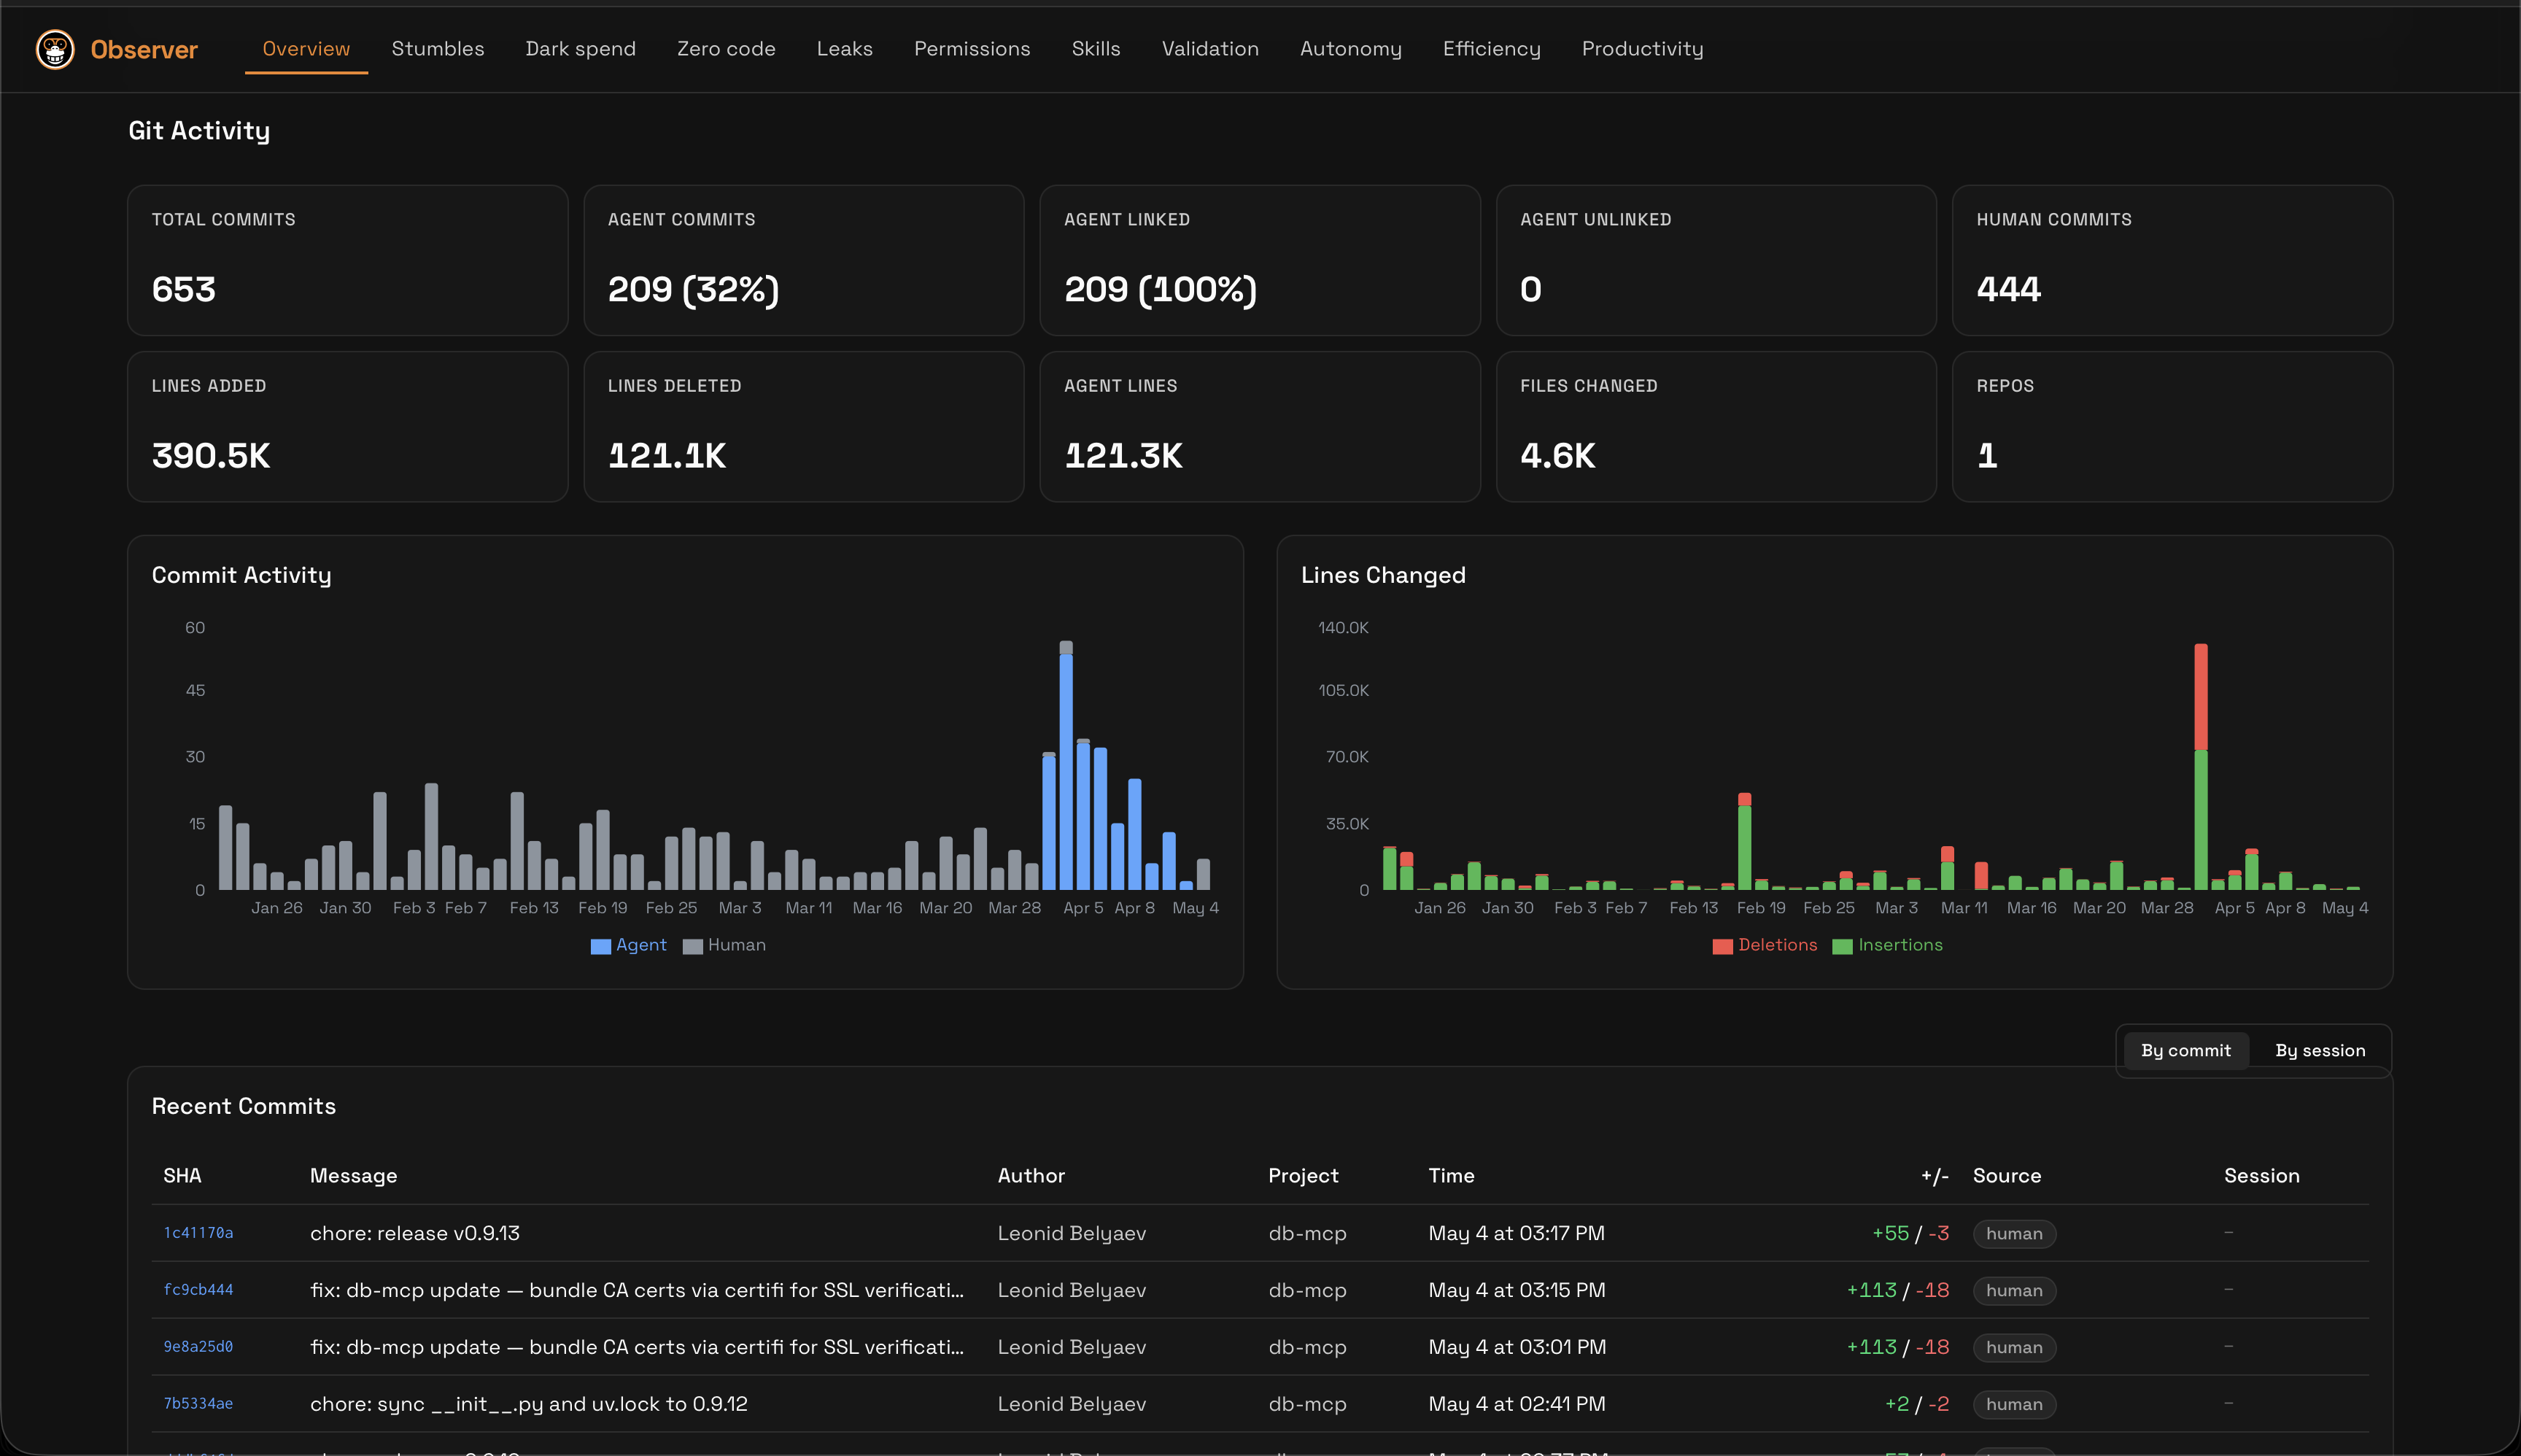
Attribute every commit to an agent or a human.
653 commits, 209 from agents (32%), 100% linked back to the session that produced them.
Compare Claude Code, Codex, and Cursor in one view.
Spend broken down by model, tool, and project. Real Cursor usage via Cursor's API, not a guess.
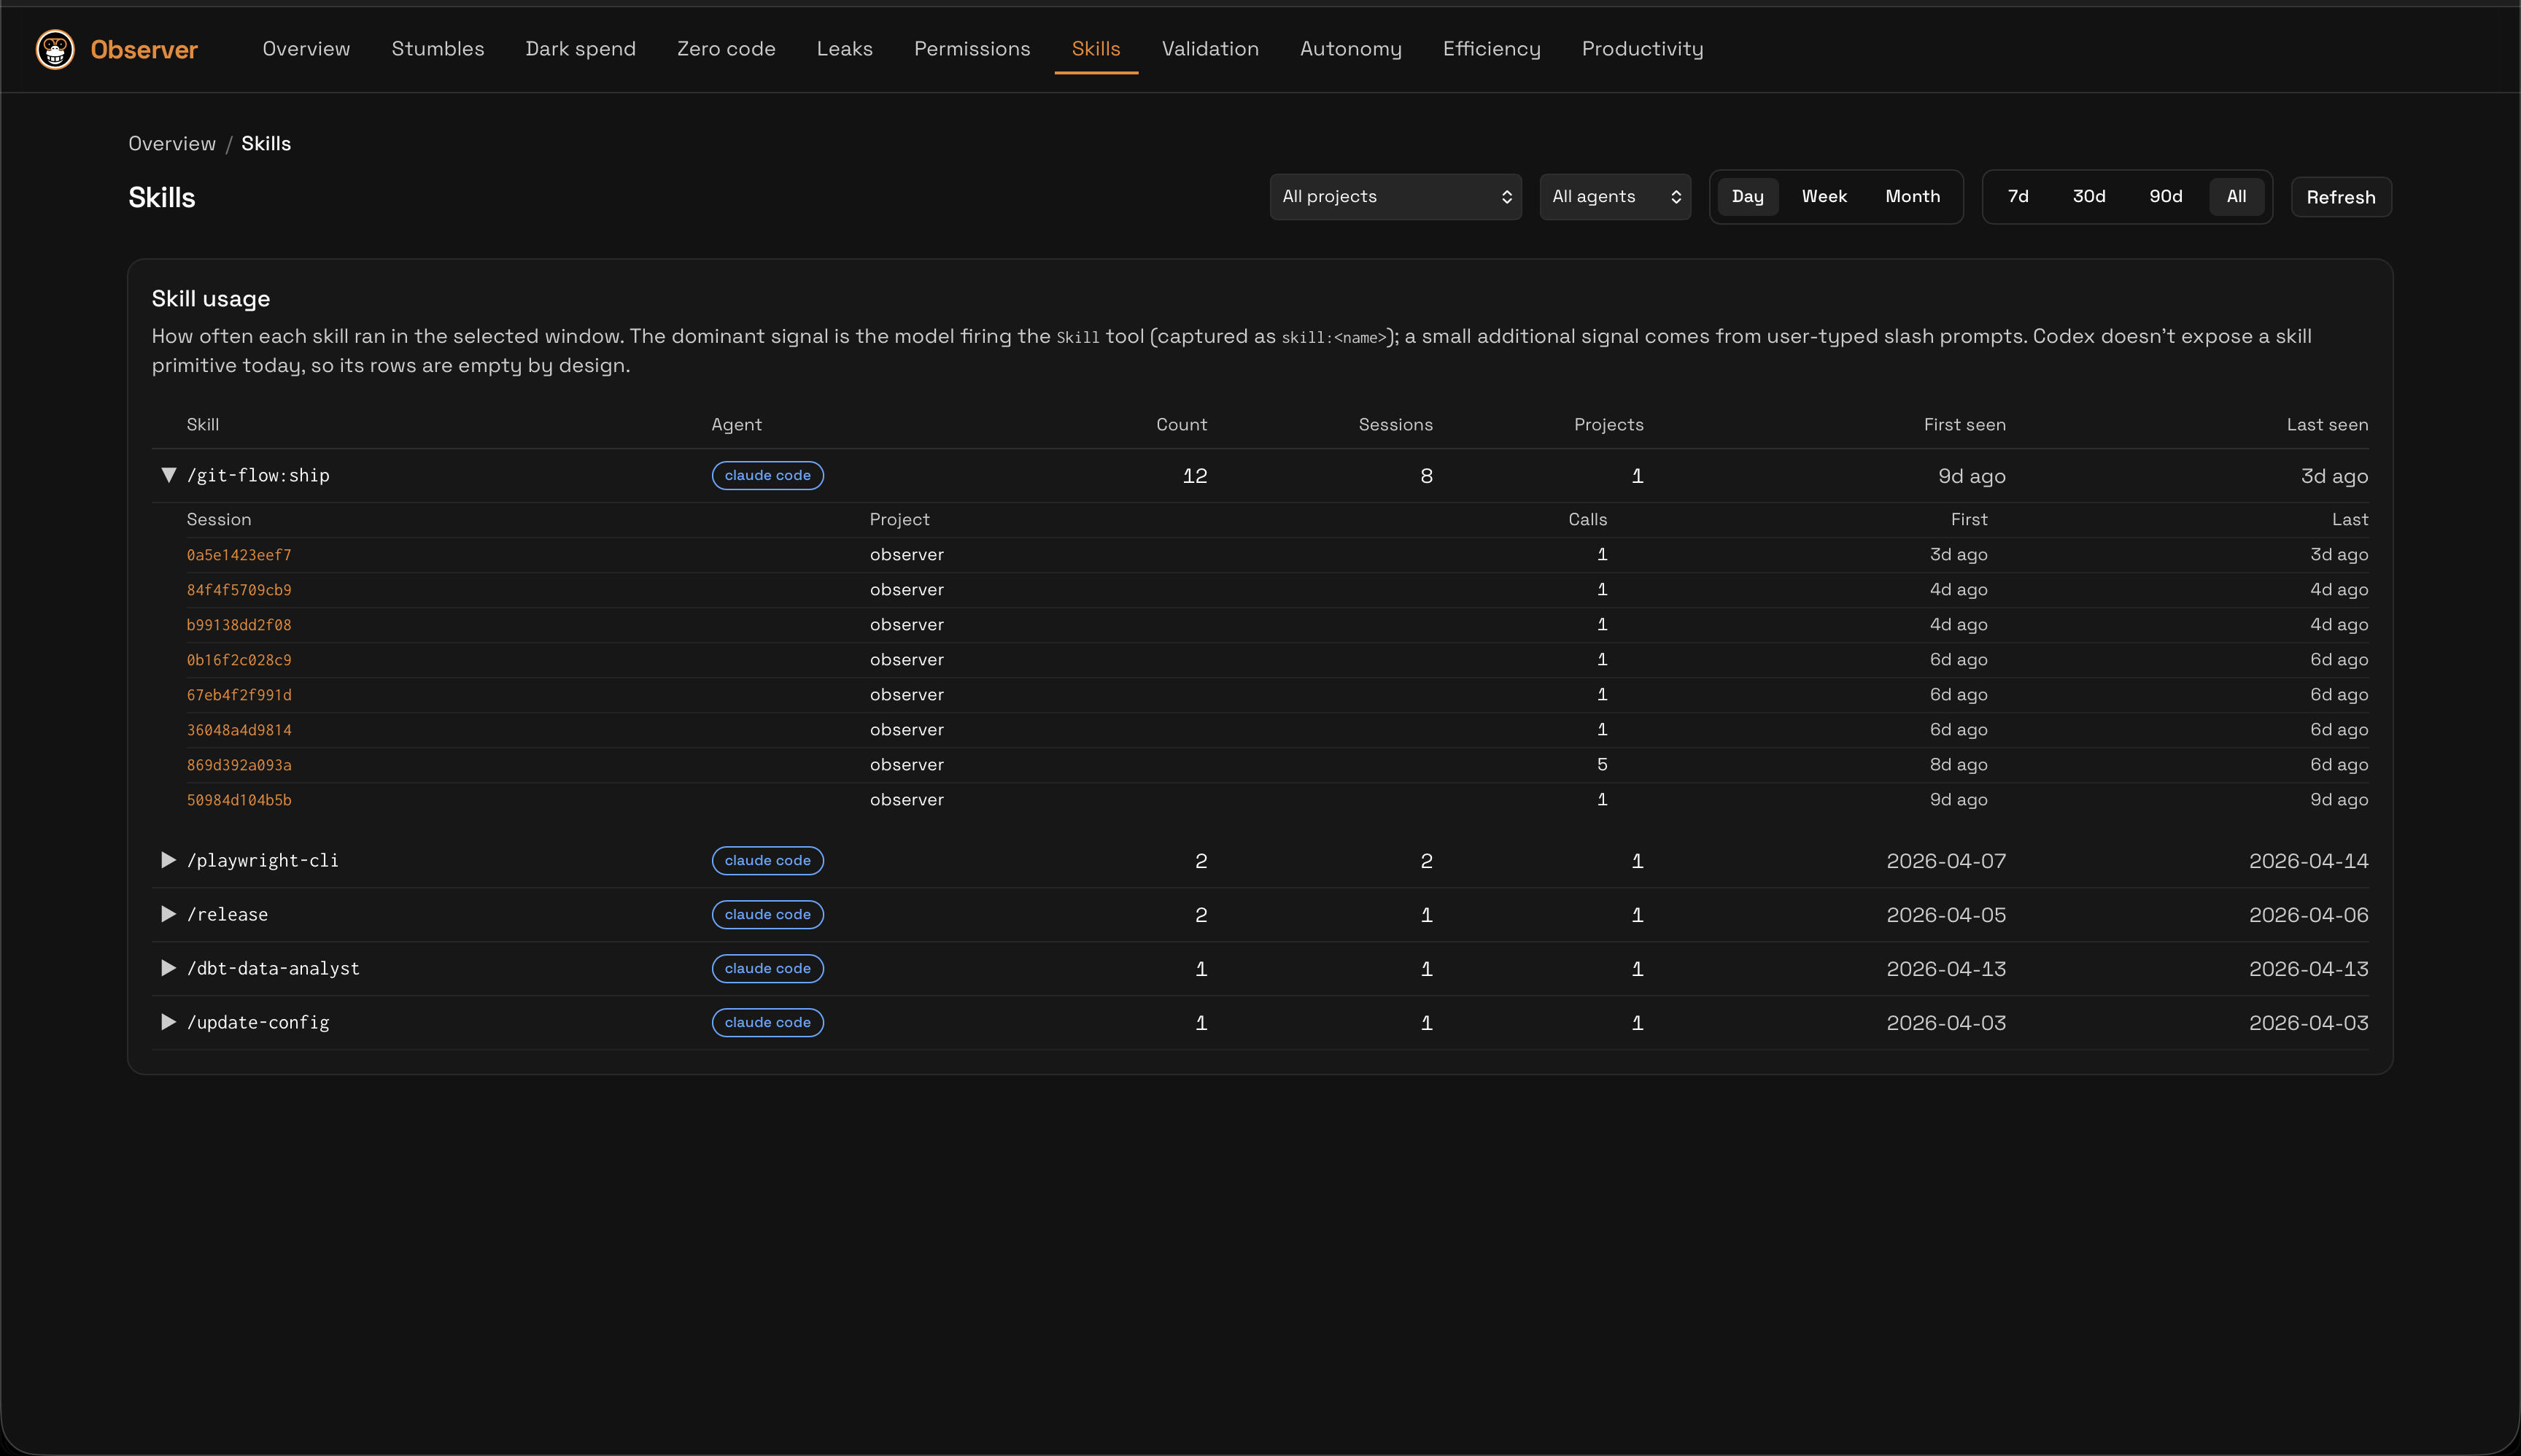
See which custom skills actually get used.
Per-skill call counts, session reach, project spread, freshness. Prune what nobody uses.
Architecture
Deploy once. Own your telemetry forever.
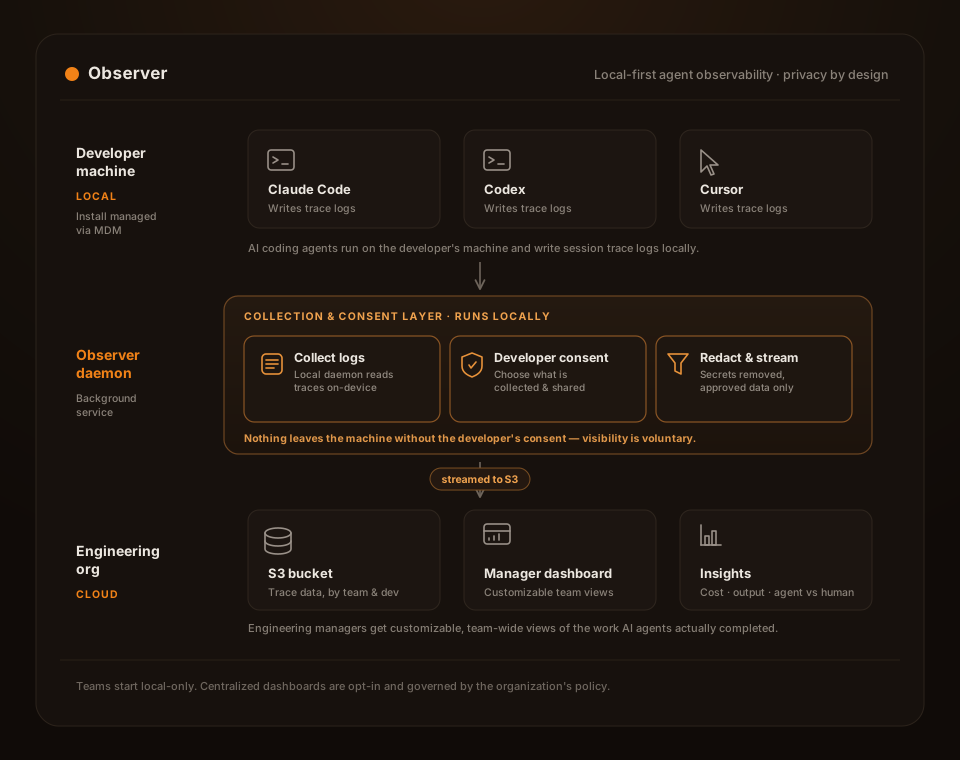
Local mode
For individual developers
- Where data lives
- Your machine, nowhere else
- Setup
- One curl + observer init
- Transport
- —
- Privacy
- Nothing leaves the laptop
Org mode
For platform / DevEx teams
- Where data lives
- Self-hosted ingestor you control
- Setup
- Reference Terraform, docker-compose, Caddy, Let's Encrypt
- Transport
- Ed25519-signed batches, dedupe at ingest
- Privacy
- Secret redaction + per-destination disclosure policy
Install
Get started in 30 seconds.
- 01Install
One curl, no dependencies.
- 02observer init
Interactive config.
- 03Open localhost:3457
Dashboard is local-only.
# Install
curl -fsSL https://observer.dev/install.sh | bash

# Configure (interactive)
observer init

# Open dashboard at localhost:3457
observer dashboard

# Or run as a background service
observer start
For teams
Rolling Observer out across 20+ engineers?
We help platform teams ship it end-to-end — Terraform, ingestor hardening, SSO, secret redaction policy. Tell us about your setup.